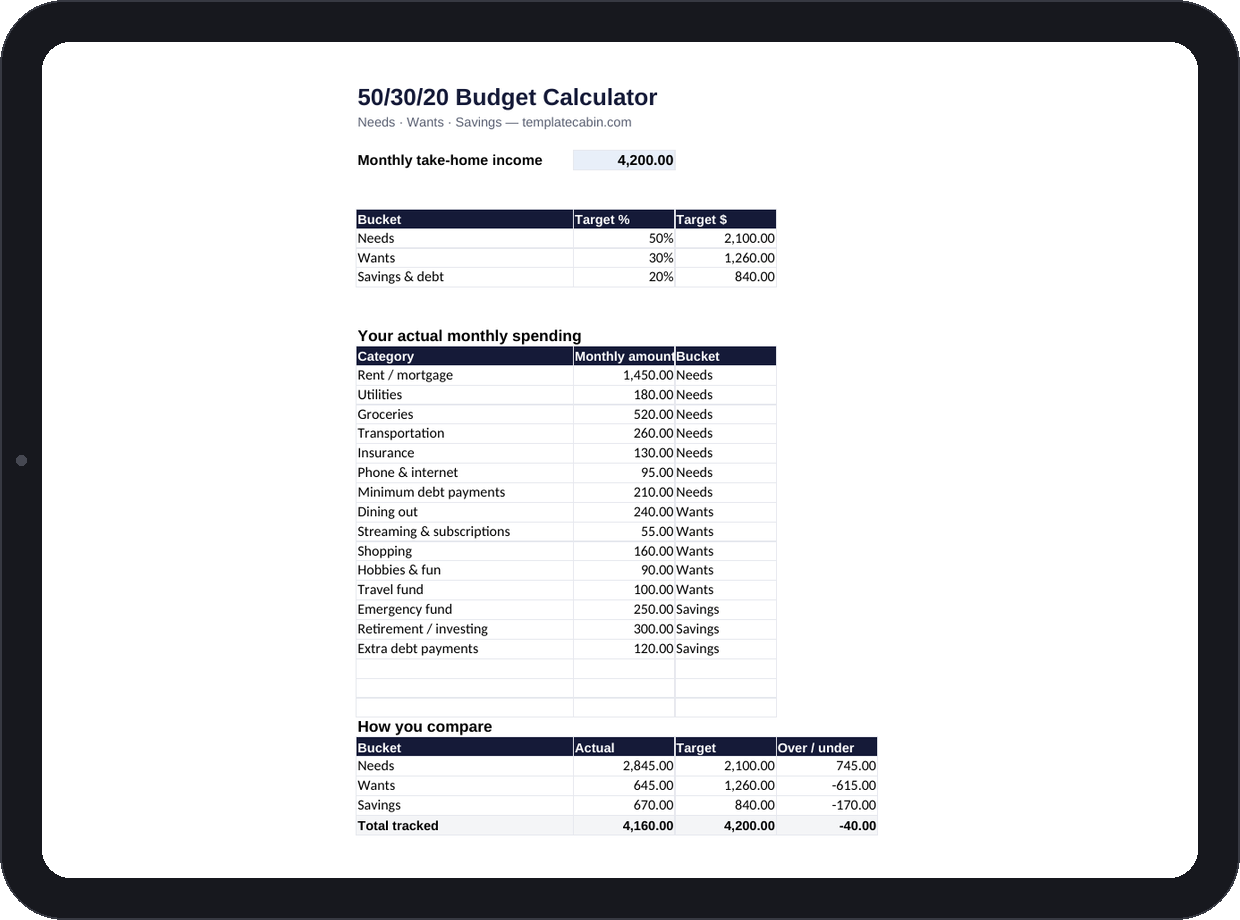
Ask most people what percentage of their income goes to needs versus wants and you’ll get a shrug. Not because they don’t care, it’s because nobody sits down and actually sorts fifteen line items into three buckets by hand. That’s the entire value of this sheet: it does the sorting math the second you type in a number, so the answer to “where does my money actually go” takes ten minutes instead of never happening.
The 50/30/20 rule itself is almost embarrassingly simple. Roughly half your take-home pay covers needs, 30% covers wants, 20% goes to savings and extra debt payments. It survives real life better than more complicated systems precisely because it’s simple enough to actually check yourself against.
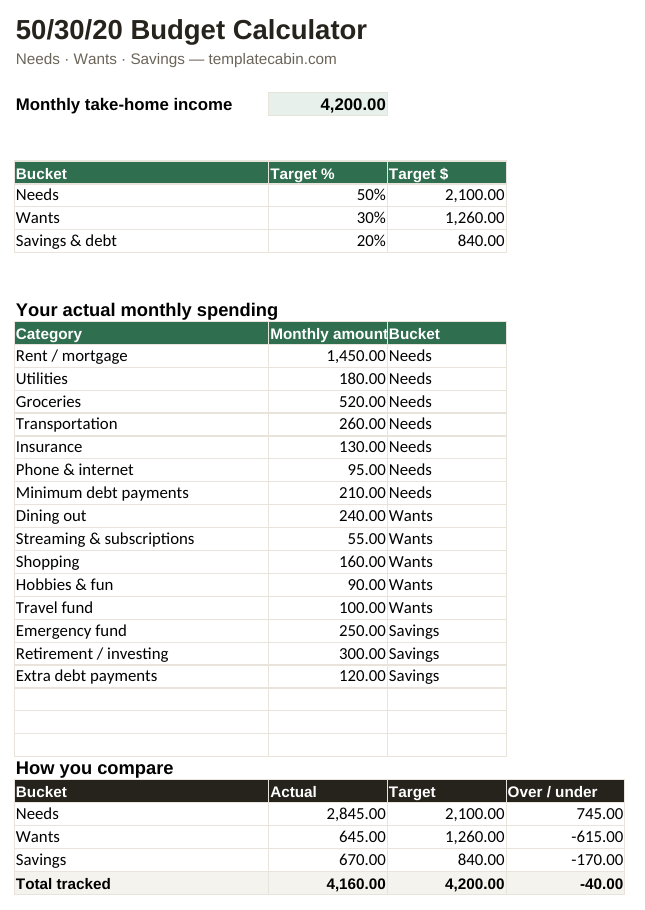
Type in your monthly take-home income and the three target dollar amounts appear immediately: at $4,200, that’s $2,100 for needs, $1,260 for wants, $840 for savings. Then work through last month’s real spending using the pre-filled category list and a dropdown that tags each row Needs, Wants, or Savings. The example lands at $2,845 in needs, which is $745 over target, alongside $645 in wants and $670 in savings.
That gap is the useful part, and it’s also the part people get wrong. A $745 overage in needs almost never means someone’s being reckless with coffee. It usually means rent is 35% of take-home on its own, and no amount of skipping lattes rebalances a housing number that size. The 50/30/20 split is a guideline, not a law: in an expensive city, something closer to 60/20/20 can be a perfectly healthy budget. What actually matters is knowing your real numbers and protecting the savings line first, whatever the needs percentage turns out to be.
The tagging step is where a lot of people find money without cutting anything. A base phone plan is a need. The unlimited-everything upgrade sitting on top of it is a want. Being honest about which is which, category by category, routinely turns up a few hundred dollars that was never a “cut back” decision in the first place, just a mislabeled one.
A few practical notes: use take-home income, not gross, since the rule is about money you can actually allocate. Redo the exercise quarterly rather than monthly, since subscriptions creep and rent changes slowly enough that fifteen minutes a quarter keeps the picture accurate. If you don’t already have a month of spending logged, the expense tracker feeds directly into this calculator once you’ve run it for a few weeks.
Free to download, works in Excel or Google Sheets (File, Import, Upload, then “Replace spreadsheet”), no signup. This is general information, not financial advice, and if a formula ever looks wrong, tell us and we’ll retest it.
Grab the file and follow the setup steps above. It takes about two minutes.
Download the calculator (.xlsx)